Configuring C++ Debugger in VS Code
Debugger: A debugger or debugging tool is a computer program used to test and debug other programs. The main use of a debugger is to run the target program under controlled conditions that permit the programmer to track its operations in progress and monitor changes in computer resources that may indicate malfunctioning code.
To start a debug session in a program first you have to make a break-point from where the malfunctioning is happening in the code, for e.g, below is a program demonstrated:

Now, Click on Run Menu => Start Debugging, then the VS code will ask you to configure the debugger because VS code only ships with Node.js Debugger by default, Click on Add Configuration, You will be redirected to a editor named “launch.json” like this:

Now You will see a Add Configuration button on the bottom right-side, Click on and Select the gdb launch

Now, Configure the launch.json file same as below code is given:
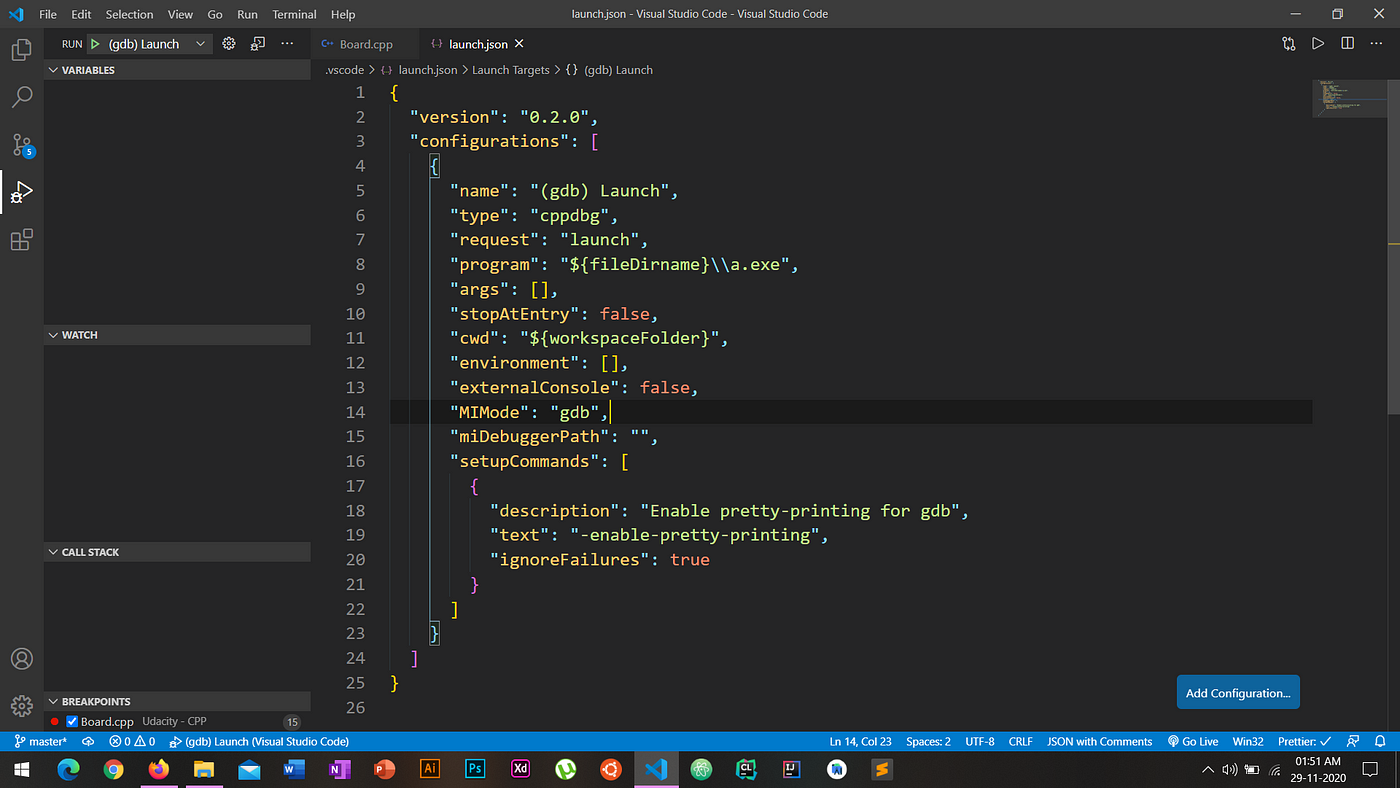
You have Careful while giving value to miDebuggerPath, if the compiler is already added in the path variable just leave it blank, it will automatically calls the gdb.exe which is the debugger of the C++ ships with MinGW library, otherwise add the folder location of the gdb.exe
Congratulations! Debugger is set. Go to terminal compile the program using -g flag with g++ which will create a.exe file in the same directory, Now just Click on Run Menu => Start Debugging.

Don’t forget to remove the break-point after work done.